In 2019, all serious website should be linked with this tool. It is also used by more and 50% of all published websites in the world.
To start with, Google Analytics is a free tool offered by Google that let you have access to a wealth of information on your visitors and your website performance. At first sight, the huge quantity of data and sections might intimidate you. This is why we suggest you to carefully read this series of articles, especially if you never tried Google Analytics before. The three most important questions a web manager should ask himself are: where are my visitors coming from, what are they doing on my website and finally, why do they leave? This tool also answers thousands of other question obviously; however, we will focus today on the Real-time and Audience sections.
Link your website with Google Analytics
Contrary to what you may believe, you do not need advanced technical knowledge to link your WebSelf website with a Google Analytics account. First of all, you need to create a Google Analytics account. When it is done, go click on the Admin section that you can find at the bottom left in order to get your ID. Find and click on the Tracking Info category in the second column, and then on Tracking Code. Your ID will appear and it is important to note it down.
Now go on your WebSelf website. Look at the bottom left of the editor page, you will have your website Settings located there. Select the Code and tracking section, enter your Google Analytics ID and click on the SAVE button located on top of the page. Go back on your Google Analytics Console page, and validate everything. It might take a few days for Google to check everything, but it will show you all your data when it is ready. It is worth all the trouble, believe us.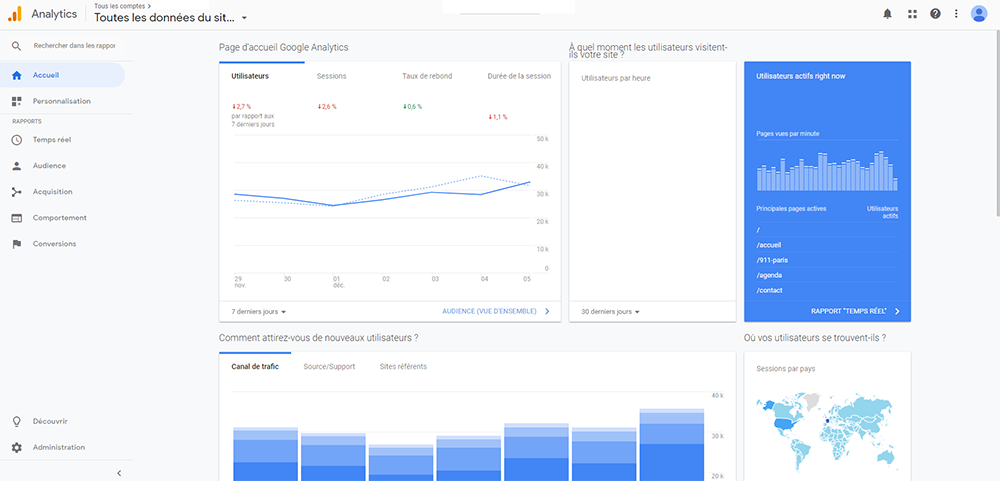
What is happening on my website right now?
ow that you have access to your website data, take a look at the Real-Time - Overview section your Google Analytics page. What you see is an insight into what is happening on your website in real time, as well as in the last minutes. If you send a newsletter or start a contest on your social media, for instance, take time to see the immediate impact of your actions. You will also see where your current visitors came from (referral or social media), from where they are, and which pages they are looking at. It is important to keep in mind that on your website debuts, you might have not a lot of visits. Do not give up and try different strategies to increase your popularity. You do not know where to start? Read our article about 5 marketing trends that will boost your small business.
Who visited my website?
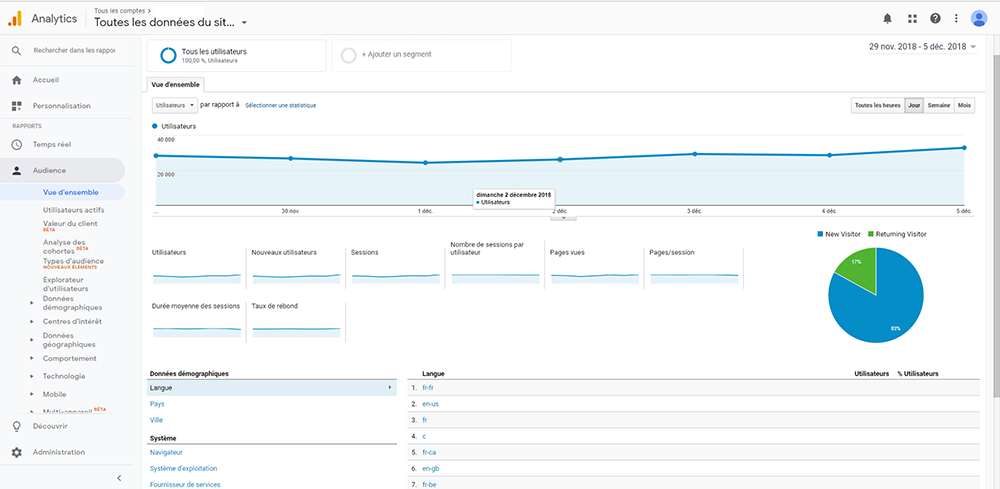
To answer this question, click on Audience and then Overview. Select the period of time you want to check (it is on the top right on the page) and explore! This page tells you who your visitors were, as well as their language, their country, and their age. This data can help you to define who your targeted audience is, which can you create more competitive marketing campaigns. You want to know if your fans are more Safari or Chrome for instance? Click on the System category below.
On another note, take time to analyze all the provided information related with your average visit duration and bounce rate. Although these two elements seem less important than your number of visits during a precise period of time, they can help you improve your website. First, the more you see a short visit duration, the more it can say that your visitors left your home page without looking at the other pages. Even though it might say that your visitors found what they were looking for very quickly, it might also say that he did not find what they needed at all. A way to improve the time duration is to write more content. Furthermore, you also need to check your bounce rate. This element is the proportion of people who only have been on one page of your website and then left. It might tell Google that your website is not of good quality or that it does not meet the visitors’ needs. Therefore, make sure to have the lowest bounce rate possible. Aim for a rate below 50%. The more high-quality pages there will be on your website, the better it will be. Create links between articles and pages to make it easy for the visitor to travel from one place to another.
It is also in the Audience section that you can find the most information on your clients. What is the average age of your audience? Is it more women or men who read your articles? What are their interests? From where are they from? Analyze all the data you can find and discover who is your typical visitor. Keep in mind who he or she is when writing new content or campaigns.
In conclusion, the Real-time and Audience are only two of the five main sections of your Google Analytics page. Do not worry about the other categories, we will see them in the second part of this series of articles. Meanwhile, we suggest you explore and tame this measurement tool. It will certainly help you to understand better your customers and be more competitive.